
Chapter 06: Interest Rates and Corporate Debt

Opening Scenario: The 2025 Interest Rate Environment
In mid-2025, Apple Inc. returned to the bond market with a multi-billion-dollar issuance spanning short-, intermediate-, and long-term maturities. Yields ranged from roughly the mid-4 percent range on shorter maturities to just over 5 percent on very long-term bonds. While these borrowing costs were well above the ultra-low rates of 2020–2021, demand for Apple’s bonds remained strong, reflecting its exceptional credit quality and stable cash flows.
At the same time, a mid-sized manufacturing firm faced a very different reality. After being downgraded from investment grade (BBB) to speculative grade (BB+), the firm found that banks and private lenders were unwilling to refinance its debt at previous terms. New borrowing now required interest rates in the 9–10 percent range, along with stricter covenants and shorter maturities. The company’s CFO was forced to reconsider expansion plans, delay capital investments, and explore alternative financing options.
This contrast between two borrowers in the same interest rate environment highlights a central lesson of corporate finance: interest rates are not uniform. They vary dramatically based on creditworthiness, maturity, liquidity, and overall market conditions. Understanding how and why these differences arise is essential for financial managers deciding how much debt to use, what type of debt to issue, and when borrowing creates value rather than risk.
Learning Objectives
By the end of this chapter, you should be able to:
- Explain what determines interest rates and their key components
- Understand the term structure of interest rates and interpret yield curves
- Value bonds using present value techniques from Chapter 3
- Distinguish among different types of corporate debt instruments
- Explain how credit ratings affect borrowing costs
- Calculate and interpret credit spreads
6.1 Interest Rate Fundamentals
An interest rate or yield is the price of borrowing money, the compensation lenders require for allowing borrowers to use their funds. Interest rates affect everything from bond prices to stock valuations to capital budgeting decisions.
More fundamentally, an interest rate reflects a trade-off between present and future consumption. By lending money today, savers give up current purchasing power in exchange for greater purchasing power in the future. By borrowing, households, firms, or governments shift consumption forward in time and must compensate lenders for waiting.
Interest rates also incorporate three key components:
- Time value of money – A dollar today is worth more than a dollar tomorrow because it can be invested or consumed immediately.
- Risk – Borrowers may default, so riskier loans require higher interest rates.
- Inflation expectations – Lenders demand compensation for expected erosion in purchasing power, which gives rise to the distinction between nominal and real interest rates.
In equilibrium, interest rates are determined by the interaction of saving and investment in the economy. When households are more willing to save, interest rates tend to fall; when firms have abundant profitable investment opportunities, interest rates tend to rise. Central banks can influence short-term interest rates, but over the long run, rates are anchored by real economic forces: productivity growth, preferences for consumption today versus tomorrow, and inflation expectations.
This view aligns with the classic economic insight that interest rates are not simply the “price of money,” but the price of current goods relative to future goods, governed by supply and demand in real markets
Components of Interest Rates
Every interest rate can be broken down into several components:
Interest Rate = Real Risk-Free Rate + Inflation Premium + Default Risk Premium + Liquidity Premium + Maturity Risk Premium
Let us examine each component.
1. Real Risk-Free Rate (1–2%)
The real risk-free rate is the fundamental return required for delaying consumption, assuming no inflation and no risk of default. It reflects pure time value of money, the compensation for waiting. This rate is determined by productivity of capital, time preferences, and economic growth. Historically, it has averaged about 1–2 percent in the United States.
2. Inflation Premium (IP)
The inflation premium compensates lenders for the expected loss of purchasing power. If inflation is expected to be 3 percent per year, lenders will demand at least 3 percent additional return just to maintain the real value of their money.
The relationship between nominal rates, real rates, and inflation is described by the Fisher equation:
Nominal Rate ≈ Real Rate + Inflation Rate
Example 6.1: The Fisher Equation
If the real risk-free rate is 2 percent and expected inflation is 3 percent, what is the nominal risk-free rate?
Nominal Rate ≈ 2% + 3% = 5%
3. Default Risk Premium (DRP)
The default risk premium compensates lenders for the risk that the borrower may fail to make promised payments. U.S. Treasury securities are considered default-free and therefore carry no default risk premium. Corporate bonds carry default risk that varies with the borrower’s creditworthiness.
A financially strong company such as Apple or Microsoft may pay a default risk premium of 0.5–1.0 percentage points above Treasuries. A financially weaker company may pay 5–10 percentage points or more.
4. Liquidity Premium (LP)
The liquidity premium compensates investors for holding securities that are difficult to sell quickly at fair prices. U.S. Treasury bonds are highly liquid and carry minimal liquidity premiums. Corporate bonds, especially those of smaller firms, are less liquid and therefore carry higher liquidity premiums, typically 0.1–2.0 percentage points.
5. Maturity Risk Premium (MRP)
The maturity risk premium compensates investors for interest rate risk, the risk that interest rates will change and cause bond prices to fluctuate. Longer-maturity bonds are more sensitive to interest rate changes and therefore carry higher maturity risk premiums. A 30-year Treasury bond typically yields 0.5–1.5 percentage points more than a 2-year Treasury bond.
For practical purposes, we can group these premiums into two main categories:
- Risk-Free Rate (RFR): This is the rate on a security with no default risk, typically a U.S. Treasury bond. It is composed of:
- Real Risk-Free Rate
- Inflation Premium (IP)
- Maturity Risk Premium (MRP)
- Risk-Free Rate (RFR): This is the rate on a security with no default risk, typically a U.S. Treasury bond. It is composed of:
Risk-Free Rate = Real Risk-Free Rate + IP + MRP
Credit Spread (or Default Spread): This is the additional yield an investor demands for taking on the risk that the corporate issuer will fail to make its payments. It is composed of:
- Default Risk Premium (DRP)
- Liquidity Premium (LP)
Credit Spread = DRP + LP
Therefore, the yield on a corporate bond can be simplified to:
Corporate Bond Yield = Risk-Free Rate + Credit Spread
Example 6.2: Decomposing Corporate Bond Yield
A 10-year corporate bond has a yield of 5.50%. The 10-year U.S. Treasury bond (the risk-free rate) has a yield of 4.26%. The real risk-free rate is estimated to be 1.50%, and the inflation premium is 2.00%.
- Calculate the Maturity Risk Premium (MRP) embedded in the Treasury bond.
- Calculate the Credit Spread on the corporate bond.
- If the Liquidity Premium (LP) on the corporate bond is 0.25%, what is the Default Risk Premium (DRP)?
Solution:
Maturity Risk Premium (MRP):
- Risk-Free Rate = Real Risk-Free Rate + Inflation Premium + MRP
- 26% = 1.50% + 2.00% + MRP
- MRP = 4.26% – 3.50% = 0.76%
Credit Spread:
- Corporate Bond Yield = Risk-Free Rate + Credit Spread
- 50% = 4.26% + Credit Spread
- Credit Spread = 5.50% – 4.26% = 1.24%
Default Risk Premium (DRP):
- Credit Spread = DRP + Liquidity Premium
- 24% = DRP + 0.25%
- DRP = 1.24% – 0.25% = 0.99%
Example 6.3: Calculate Corporate Bond Yield
You are tasked with estimating the yield for a new 10-year, BBB-rated corporate bond. You have the following market data:
- Real Risk-Free Rate: 1.75%
- Expected Inflation (10-year average): 2.25%
- Maturity Risk Premium (10-year): 0.80%
- Credit Spread for BBB-rated bonds: 0.94% (Source: FRED, Jan 2026)
Calculate the estimated yield on the BBB-rated corporate bond.
Solution:
Calculate the Risk-Free Rate:
- Risk-Free Rate = Real Risk-Free Rate + Inflation Premium + MRP
- Risk-Free Rate = 1.75% + 2.25% + 0.80% = 4.80%
Calculate the Corporate Bond Yield:
- Corporate Bond Yield = Risk-Free Rate + Credit Spread
- Corporate Bond Yield = 4.80% + 0.94% = 5.74%
The 2020–2025 Interest Rate Cycle
The period from 2020 through 2025 represents one of the most dramatic and instructive interest rate cycles in modern U.S. monetary history, marked by unprecedented easing, rapid tightening, and a cautious return toward normalization.
2020–2021: Pandemic-Era Monetary Easing
In response to the COVID-19 pandemic and the resulting economic shock, the Federal Reserve cut the federal funds rate to near zero (0–0.25 percent). The goal was to stabilize financial markets, support employment, and prevent a deep recession. During this period, the 10-year U.S. Treasury yield briefly fell below 0.5 percent—an all-time low. Corporations took advantage of these historically low rates, issuing record amounts of long-term debt at minimal borrowing costs, often extending maturities and refinancing existing obligations.
2022–2023: Rapid Tightening to Combat Inflation
As the economy reopened, inflation surged to levels not seen in four decades, peaking at 9.1 percent in June 2022. In response, the Federal Reserve launched one of the fastest tightening cycles in its history, raising the federal funds rate from near zero to approximately 5.25–5.50 percent in just 16 months. Long-term interest rates rose sharply, with the 10-year Treasury yield climbing above 5 percent at its peak. Asset prices fell, borrowing costs increased, and interest rate risk became a central concern for investors and corporate financial managers.
2024–2025: Gradual Easing and Policy Recalibration
By 2024, inflation showed clear signs of moderation, trending back toward the Federal Reserve’s 2 percent target. In September 2024, the Fed initiated its first rate cut of the cycle, reducing the federal funds rate by 0.5 percentage points. This marked a shift from aggressive tightening to cautious recalibration. Throughout 2025, the Fed continued to ease policy modestly, signaling a data-dependent approach aimed at balancing inflation control with economic growth and financial stability.
Why This Cycle Matters
This five-year period reshaped the financial landscape. It reinforced the sensitivity of asset prices to interest rates, highlighted the importance of duration and maturity structure, and underscored how quickly borrowing conditions can change. For corporate financial managers, the lesson is clear: interest rate environments are dynamic, and financing decisions must account not only for current rates but also for the risks of future policy shifts.
As of mid-January 2026 the representative rates in the US were:
Security | Yield |
Effective Fed Funds rate | 3.64% |
3-Month Treasury Bill | 3.7% |
10-Year Treasury Note | 4.2% |
30-Year Treasury Bond | 4.8% |
AAA Corporate Bonds (10Y) | 4.7% |
BBB Corporate Bonds | 5.1% |
High-Yield Bonds | 6.4% |
Federal Funds Rate
The federal funds rate is the interest rate at which commercial banks lend excess reserves to one another overnight. It serves as the Federal Reserve’s primary policy tool for influencing short-term interest rates and overall financial conditions in the economy. By raising or lowering its target range for the federal funds rate, the Fed affects borrowing costs, spending, inflation, and economic activity.
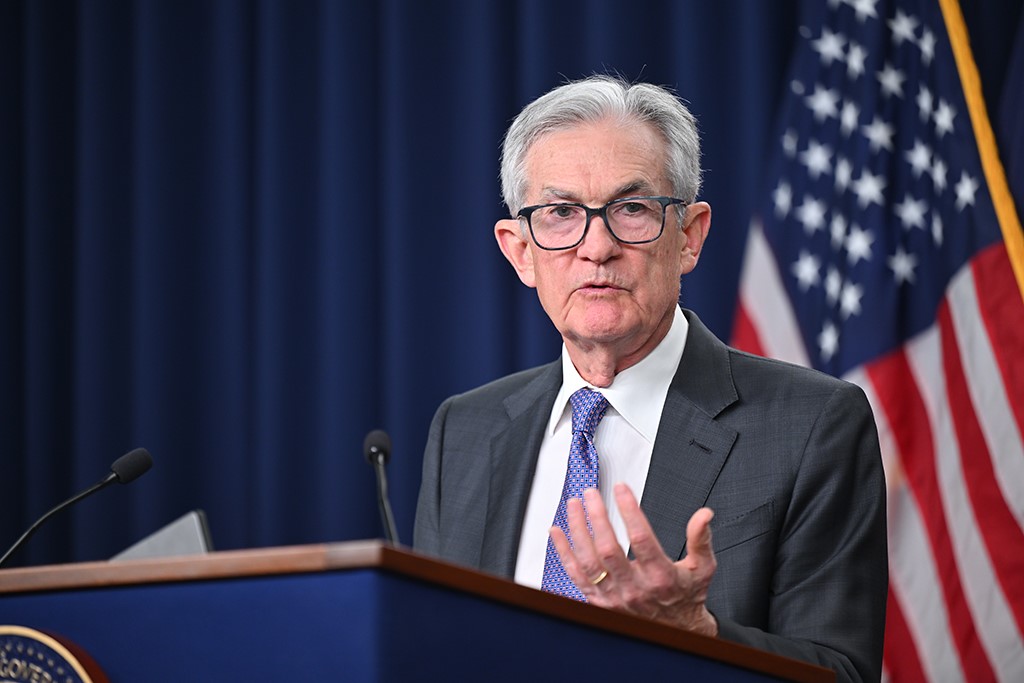
Figure 6.1: Federal reserve
Federal Reserve Chair Jerome Powell answers reporters’ questions at the FOMC press conference on December 10, 2025. Source:
Federal Reserve Chair Jerome Powell answers reporters’ questions at the FOMC press conference on December 10, 2025. Source: https://www.flickr.com/photos/federalreserve/
6.2 The Term Structure of Interest Rates
The term structure of interest rates describes the relationship between interest rates and time to maturity. This relationship is shown graphically by the yield curve, which plots yields against maturity for bonds of similar credit quality, typically U.S. Treasuries.
1. Normal (Upward-Sloping) Yield Curve
A normal yield curve slopes upward, with longer-maturity bonds yielding more than shorter-maturity bonds. This is the most common shape, occurring about 70–80 percent of the time.
Example:
2-year Treasury yields 3 percent
10-year yields 4 percent
30-year yields 4.5 percent
2. Inverted (Downward-Sloping) Yield Curve
An inverted yield curve slopes downward, with shorter-maturity bonds yielding more than longer-maturity bonds. This shape is rare and often signals an upcoming recession.
Example:
2-year Treasury yields 5 percent
10-year yields 4 percent
30-year yields 3.8 percent
The yield curve inverted during 2022–2023, with 2-year yields exceeding 10-year yields by as much as 1 percentage point. Historically, yield curve inversions have preceded every U.S. recession since 1970.
3. Flat Yield Curve
A flat yield curve shows little difference in yields across maturities and often represents a transition between normal and inverted curves.
Example:
2-year Treasury yields 4.2 percent
10-year yields 4.3 percent
30-year yields 4.4 percent
Why the Yield Curve Matters
The yield curve provides insights into:
- Economic expectations: An inverted curve suggests investors expect economic weakness and falling rates
- Fed policy: The curve reflects expectations of future Fed actions
- Recession signal: Inversions have historically preceded recessions by 6-24 months
- Borrowing decisions: Companies consider the yield curve when choosing debt maturities
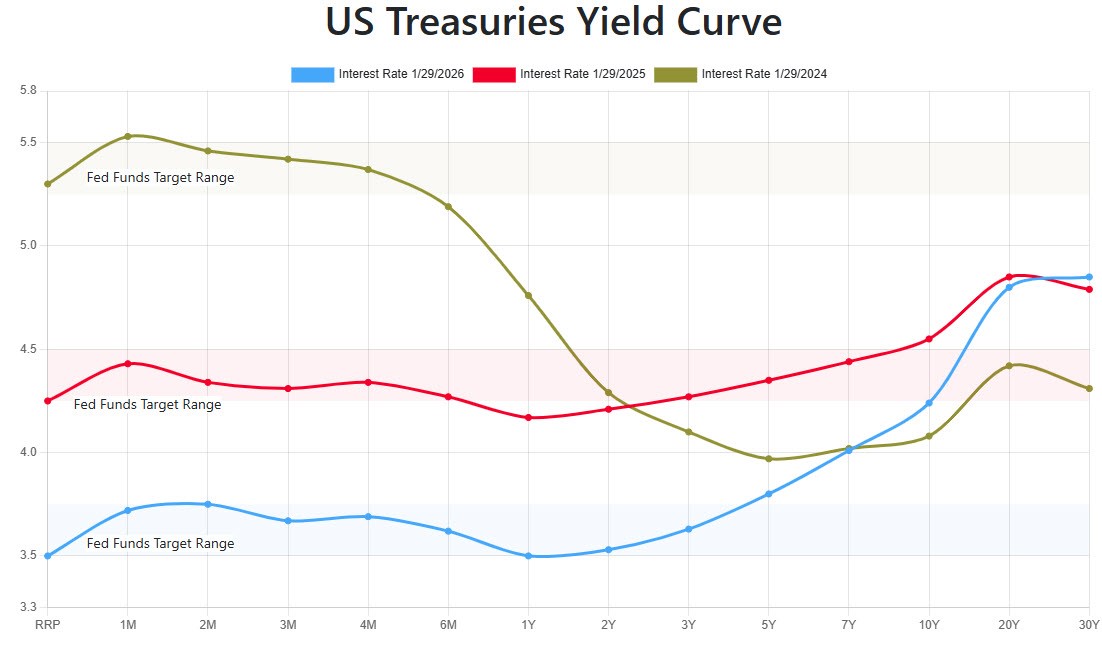
Figure 6.2: US Treasuries yield curve
6.3 Bond Valuation
A bond is a promise—specifically, a promise by the issuer to make a series of fixed payments to the bondholder. Bond valuation asks a simple but powerful question:
What is that promise worth today?
The answer follows directly from the time value of money. A bond’s value is the present value of the cash flows it promises, discounted at a rate that reflects their risk.
This logic is the same whether the bond is issued by the U.S. Treasury, Apple, or a risky startup—the only things that change are the cash flows and the required return.
Bond Cash Flows
Most plain-vanilla bonds generate two types of cash flows:
1. Coupon Payments
These are periodic interest payments. For simplicity, we assume annual coupons (though many bonds pay semiannually).
\(\text{Annual Coupon Payment} = \text{Coupon Rate} \times \text{Face Value}\)
2. Principal (Face Value) Payment
At maturity, the issuer repays the bond’s face value (also called par value).
Example 6.4: Bond Cash Flows
A bond has:
- Face value = $1,000
- Coupon rate = 6%
- Maturity = 10 years
Annual coupon payment:
\(0.06 \times 1000 = \$60\)
Cash flows:
- Years 1–9: $60 each year
- Year 10: \($60 + $1,000 = $1,060\)
This pattern—small payments over time plus a large payment at the end—is what drives bond valuation.
The Bond Valuation Principle
The value of a bond is simply the present value of all promised cash flows, discounted at the bond’s required return (also called the yield).
\(\text{Bond Value} = \text{PV of Coupons} + \text{PV of Principal}\)
For a bond with annual coupons:
\( \text{Bond Value} = C \times \frac{1 – (1 + r)^{-n}}{r} + \frac{FV}{(1 + r)^{n}} \)
Where:
- C = annual coupon payment
- r = required annual return (yield)
- n = years to maturity
- FV = face value
This formula looks technical, but the intuition is simple:
- The first term values the stream of coupon payments (an annuity).
- The second term values the lump-sum repayment of principal.
Example 6.5: Bond Valuation
A bond has:
- Face value = $1,000
- Coupon rate = 6% (so \( C = $60\) )
- Maturity = 10 years
- Required return = 8%
Step 1: Present value of coupons
\( PV_{\text{coupons}} = 60 \times 6.7101 = \$402.61 \)
Step 2: Present value of principal
\( PV_{\text{principal}} = \frac{1,000}{(1.08)^{10}} = 1,000 \times 0.4632 = \$463.19 \)
Bond value:
\( \$402.61 + \$463.19 = \boxed{\$865.80} \)
Because the required return (8%) exceeds the coupon rate (6%), the bond sells below par.
Discount, Par, and Premium Bonds
Bond prices fall into three intuitive categories:
- Discount Bond
Coupon rate < Required return
→ Price < Face value - Par Bond
Coupon rate = Required return
→ Price = Face value - Premium Bond
Coupon rate > Required return
→ Price > Face value
- Discount Bond
Example 6.6: Discount, Par, and Premium
A $1,000 bond with a 6% coupon and 10 years to maturity:
Required Return | Bond Value | Classification |
8% | $865.80 | Discount |
6% | $1,000.00 | Par |
4% | $1,162.22 | Premium |
The bond’s cash flows never change—only the discount rate does.
The Inverse Price–Yield Relationship
Bond prices and yields move in opposite directions.
- When interest rates rise, bond prices fall
- When interest rates fall, bond prices rise
Why?
Because bonds promise fixed cash flows. When new bonds offer higher yields, existing bonds must drop in price to remain competitive.
Price Sensitivity
For our 10-year, 6% coupon bond:
Required Return | Bond Price | % Change |
4% | $1,162 | +16.2% |
6% | $1,000 | Baseline |
8% | $866 | −13.4% |
A modest 2-percentage-point change in interest rates causes a double-digit percentage change in price. This is interest rate risk—a central risk faced by bond investors.
Yield to Maturity (YTM)
The yield to maturity is the bond’s internal rate of return—the discount rate that equates the bond’s price to the present value of its cash flows. The YTM is the interest rate or simply the yield on that bond.
It answers the question:
“If I buy this bond today and hold it to maturity, what annual return will I earn?”
Example 6.7: Yield to Maturity
A bond with:
- Face value = $1,000
- Coupon = 6%
- Maturity = 10 years
- Price = $900
We solve:
\( 900 = 60 \times \frac{1 – (1 + r)^{-10}}{r} + \frac{1,000}{(1 + r)^{10}} \)
Using Excel or a financial calculator:
\(\text{YTM} \approx 7.4\%\)
Because the bond sells at a discount, YTM exceeds the coupon rate.
Key Relationships to Remember
- Discount bond: Coupon rate < YTM
- Par bond: Coupon rate = YTM
- Premium bond: Coupon rate > YTM
Why Bond Valuation Matters
Bond valuation is not just about bonds:
- It explains why interest rate changes move asset prices
- It underlies loan pricing, mortgage valuation, and capital budgeting
- It provides the intuition for duration, convexity, and risk management
In short, if you understand bond valuation, you understand the mechanics of modern finance.
6.4 Interest Rate Risk
Bond prices fluctuate as interest rates change, exposing bondholders to interest rate risk. This risk arises because bonds promise fixed cash flows. When market interest rates move, the present value of those fixed cash flows changes.
The primary measure of interest rate risk is duration.
Duration: Measuring Interest Rate Sensitivity
Duration measures how sensitive a bond’s price is to changes in interest rates. It provides an approximate relationship between changes in yields and changes in bond prices.
A commonly used approximation is:
\(\text{Percentage Price Change} \approx -\,\text{Duration} \times \text{Change in Yield}\)
This formula tells us that bond prices and yields move in opposite directions.
Example 6.: Using Duration
A bond has a duration of 7 years. Suppose market yields increase by 1 percent.
\(\text{Percentage Price Change} \approx -7 \times 0.01 = -0.07 = -7\%\)
If the bond was originally worth $1,000, its price would fall to approximately:
\(1{,}000 \times (1 – 0.07) = \$930\)
This example highlights how even small changes in interest rates can produce large changes in bond prices, particularly for long-duration bonds.
What Affects Duration
Duration, and therefore interest rate risk, is higher under three conditions:
- Longer maturity
Bonds with longer maturities have higher duration. A 30-year bond is far more sensitive to interest rate changes than a 5-year bond. - Lower coupon rate
Bonds with lower coupon payments have higher duration because more of their value comes from distant cash flows. Zero-coupon bonds have especially high duration. - Lower yield
Duration increases as yields fall. In low interest rate environments, bond prices become more sensitive to rate changes.
- Longer maturity
Example 6.9: Duration Comparison
Bond | Maturity | Coupon | Duration |
A | 5 years | 6% | 4.3 years |
B | 10 years | 6% | 7.4 years |
C | 20 years | 6% | 11.5 years |
D | 10 years | 0% | 10.0 years |
Bond C, with the longest maturity, and Bond D, the zero-coupon bond, have the highest durations and therefore the highest interest rate risk.
Practical Implications
- Investors expecting interest rates to fall benefit from holding long-duration bonds. These bonds experience the largest price increases when yields decline.
- Investors seeking to minimize interest rate risk prefer short-duration bonds. Short maturity and high coupon bonds are less sensitive to changes in interest rates.
Duration provides a clear framework for understanding how bond portfolios respond to changes in monetary policy and market interest rates.
6.5 Types of Corporate Debt
Companies can raise debt capital using a wide range of instruments. These instruments differ in maturity, risk, flexibility, and cost. Understanding these differences helps financial managers choose the appropriate form of debt financing.
Bank Loans vs. Bonds
Bank Loans (Private Debt)
- Negotiated directly with banks
- Shorter maturities, typically 1 to 7 years
- Often secured by collateral
- Usually floating-rate, with interest adjusting as market rates change
- More flexible and easier to renegotiate
- Commonly used by smaller or mid-sized firms
Bonds (Public Debt)
- Sold to many investors in public markets
- Longer maturities, often 5 to 30 years
- Typically unsecured
- Usually fixed-rate
- Standardized terms and difficult to renegotiate
- More suitable for large, well-known firms
Seniority: Senior vs. Subordinated Debt
Senior debt has priority in bankruptcy. Senior creditors are paid first from the firm’s assets, making this form of debt less risky and therefore cheaper.
Subordinated debt, also called junior debt, is paid only after senior debt is fully satisfied. Because subordinated creditors bear more risk, they demand higher interest rates.
Example 6.10: Bankruptcy Recovery
A firm has:
- $100 million in assets
- $80 million in senior debt
- $40 million in subordinated debt
In liquidation:
- Senior debt holders receive $80 million, or 100 percent recovery
- Subordinated debt holders receive $20 million, or 50 percent recovery
- Equity holders receive $0
Security: Secured vs. Unsecured Debt
Secured debt is backed by specific collateral. If the borrower defaults, lenders can seize the collateral. Examples include mortgage bonds secured by real estate and equipment loans secured by machinery. Secured debt carries lower interest rates due to reduced risk.
Unsecured debt, also called debentures, is backed only by the borrower’s general creditworthiness. Because investors have no claim on specific assets, unsecured debt carries higher interest rates.
Special Features of Corporate Bonds
Callable Bonds
These bonds allow the issuer to redeem the bond before maturity. Firms typically call bonds when interest rates fall so they can refinance at lower rates. Investors dislike this feature and demand higher yields as compensation.
Convertible Bonds
Convertible bonds give investors the option to convert the bond into common stock at a predetermined price. This option becomes valuable if the stock price rises, allowing issuers to offer lower coupon rates.
Zero-Coupon Bonds
Zero-coupon bonds make no periodic interest payments. They are sold at a deep discount and pay face value at maturity. Because all cash flows occur at maturity, these bonds have very high duration and significant interest rate risk.
Floating-Rate Notes
Floating-rate notes have coupons that adjust periodically based on a reference rate such as SOFR plus a spread. Because the coupon resets, bond prices remain close to par, which largely eliminates interest rate risk for investors.
6.5 Types of Corporate Debt
Not all borrowers are equally likely to repay their debts. The risk that a borrower will fail to make promised payments is known as credit risk or default risk. Because this risk varies widely across issuers, investors rely on credit ratings to assess it.
Credit ratings provide a standardized, widely understood measure of an issuer’s creditworthiness.
Rating Agencies and Categories
Three major agencies dominate the global credit rating industry: Standard & Poor’s, Moody’s, and Fitch. These agencies analyze an issuer’s financial condition, cash flow stability, leverage, and business risk, then assign letter-grade ratings.
Investment Grade Bonds (Low Default Risk)
S&P/Moody’s Ratings | Description |
AAA / Aaa | Highest quality, minimal default risk |
AA / Aa | Very high quality, very low risk |
A | Upper-medium grade, low risk |
BBB / Baa | Medium grade, moderate risk |
BB / Ba | Speculative, high risk |
B | Highly speculative, significant risk |
CCC / Caa | Substantial risk, very high risk |
D / C | In default |
The dividing line between investment grade and speculative grade is critical. Many pension funds, insurance companies, and mutual funds are legally or contractually restricted to holding only investment-grade bonds. When a bond is downgraded from BBB to BB, forced selling often follows, causing prices to fall and yields to rise sharply.
Default Rates by Credit Rating
Historical data show that default risk rises rapidly as ratings decline.
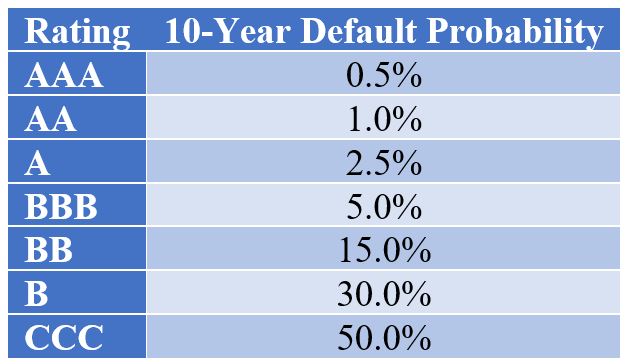
A BBB-rated bond has roughly a 5 percent chance of default over ten years. A B-rated bond has about a 30 percent chance of default over the same horizon. This sharp increase in default risk explains why lower-rated bonds must offer much higher yields to attract investors.
Selected Corporate Examples (2025)
- AAA: Microsoft, Johnson & Johnson
- AA: Apple, Alphabet
- A: Walmart, Coca-Cola
- BBB: Ford Motor, Delta Air Lines
- BB: AMC Entertainment
- B: Carnival Cruise Lines
Only a handful of corporations maintain AAA ratings. Most large firms borrow at A or BBB levels, balancing borrowing costs against financial flexibility.
6.7 Credit Spreads
Credit risk is reflected directly in bond yields through credit spreads.
The credit spread is the difference between the yield on a corporate bond and the yield on a Treasury bond of the same maturity.
\(\text{Credit Spread} = \text{Corporate Bond Yield} – \text{Treasury Yield}\)
Treasury securities are considered default-free. Any additional yield on a corporate bond compensates investors for default risk, liquidity risk, and risk aversion.
Example 6.11: Calculating a Credit Spread
A ten-year BBB-rated corporate bond yields 5.8 percent. The ten-year Treasury yields 4.4 percent.
\(\text{Credit Spread} = 5.8\% – 4.4\% = 1.4\%\)
The spread is 1.4 percentage points, or 140 basis points. Investors require this additional return to hold the BBB bond instead of a Treasury security.
Typical Credit Spreads (2025)
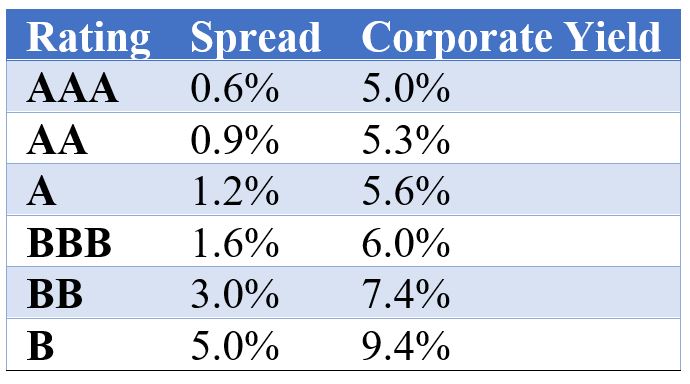
As credit quality declines, spreads widen rapidly. The relationship is nonlinear. Moving from BBB to BB increases spreads far more than moving from AA to A.
What Determines Credit Spreads
Credit spreads change over time and across issuers due to several factors:
- Default risk
Higher expected default probabilities lead to wider spreads. - Economic conditions
During recessions, investors demand safety. Spreads widen sharply as capital flows toward Treasuries. During expansions, spreads narrow. - Liquidity
Bonds that trade infrequently or in small volumes require higher yields. - Investor risk appetite
When investors become more risk-averse, spreads widen even if fundamentals do not change.
- Default risk
Historical Perspective
- During the 2008 financial crisis, BBB credit spreads widened from roughly 150 basis points to over 500 basis points.
- In March 2020, during the COVID shock, high-yield spreads briefly exceeded 1,000 basis points before Federal Reserve intervention stabilized markets.
These episodes highlight a key lesson of finance: credit risk is not constant. It is highly sensitive to macroeconomic conditions, investor psychology, and financial system stress.
Chapter Summary
This chapter examined the fundamental mechanics of interest rates and bonds, which form the backbone of modern financial markets and corporate financing decisions. We began by defining interest rates as the price of borrowing money and decomposed them into their core components, including the real risk-free rate, inflation expectations, default risk, liquidity, and maturity risk. Understanding these components helps explain why borrowing costs vary so widely across borrowers, maturities, and economic conditions.
We then explored the term structure of interest rates and the yield curve, showing how its shape reflects market expectations about future economic activity and monetary policy. Normal, inverted, and flat yield curves convey important signals about growth, recession risk, and investor sentiment, making them essential tools for both investors and financial managers.
The chapter next focused on bond valuation. We showed that the value of a bond is the present value of its future cash flows and demonstrated how bond prices depend on coupon rates, yields, and time to maturity. The inverse relationship between bond prices and yields lies at the heart of interest rate risk, which we quantified using duration. Longer maturities, lower coupons, and lower yields all increase a bond’s sensitivity to interest rate changes.
We also examined the wide range of corporate debt instruments, highlighting differences between bank loans and bonds, senior and subordinated debt, secured and unsecured claims, and special features such as callability, convertibility, and floating-rate coupons. These design choices affect both borrowing costs and financial flexibility.
Finally, we addressed credit risk and credit spreads. Credit ratings summarize default risk, while credit spreads measure the market’s required compensation for bearing that risk. Spreads widen during periods of economic stress and narrow during expansions, reflecting changing risk perceptions rather than changes in promised cash flows.
Together, these concepts provide the foundation for understanding the cost of debt, which combines with the cost of equity from Chapter 7 to determine the weighted average cost of capital in Chapter 8. Mastery of interest rates and bond valuation is therefore essential not only for investors, but also for managers making capital budgeting, financing, and valuation decisions
References
Board of Governors of the Federal Reserve System. (2025). Selected Interest Rates.
Damodaran, A. (2014). Applied Corporate Finance (4th ed.). John Wiley & Sons.
Federal Reserve Economic Data (FRED). St. Louis Federal Reserve Bank.
Landsburg, S. E. (2012). The Armchair Economist: Economics and Everyday Life (Rev. ed.). Free Press.
U.S. Department of the Treasury. (2025). Daily Treasury Par Yield Curve Rates.
Welch, I. (2022). Corporate Finance (5th ed.).