
Chapter 16: Wholesale and Retail Food Markets
Wholesale and Retail Food Markets
Merchandising, merchandising, where the real money from the movie is made. Spaceballs-the T-shirt, Spaceballs-the Coloring Book, Spaceballs-the Lunch box, Spaceballs-the Breakfast Cereal, Spaceballs-the Flame Thrower.
Yogurt (Mel Brooks in the movie, Spaceballs.)
Beyond the farm gate are a variety of wholesalers, brokers, and retailers. Typically, food purchases by the consumer are divided into food away from home and food at home. These two channels have quite different requirements and characteristics. Although these two sectors are dissimilar, trends that will be discussed in this chapter are blurring some of the traditional lines.
There is a third category, local foods, that will be discussed in Chapter 17. This category tends to blur the distinction between food away from home and food at home.
Food prices have become a contentious political issue. The all-food Consumer Price Index (CPI) rose 25 percent from 2019 to 2023. Only the transportation sector experienced higher inflation during that period. Figure 16.1 illustrates the breakdown between categories of elements of the CPI.
A confluence of factors caused food price inflation. The COVID-19 pandemic caused supply chain disruptions and shifted consumption patterns in the 2020-21 period. The bird flu caused a spike in poultry and egg prices in 2022. The Russo-Ukrainian War, that began in February 2014, entered a new phase in in February 2022 with the full-scale Russian invasion of Ukraine. This war has had impacts on fertilizer, energy, and grain prices. It is likely to continue to cause market disruptions.
FOOD-AT-HOME (FAH) VERSUS FOOD-AWAY-FROM-HOME (FAFH)
Grocery stores supply much of the food eaten at home. The business is highly concentrated in a few large chains. Walmart (including Sam’s Club) is by far the largest with FY 2023 sales of $505 billion. Kroger is the largest traditional grocer in the U.S. with over $148 billion in sales. Costco had an estimated $97 billion in grocery sales. Albertson had $77.65 billion in sales. Completing the top five for FY 2023 was Ahold Delhaize USA with $56.72 billion in sales.
Kroger and Albertson have proposed a merger. The Federal Trade Commission (FTC) has opposed the merger. It has demanded that Kroger and Albertson sell 168 stores as a condition of the merger. The FTC filed suit in opposition to the merger on February 26. 2024. Separately the FTC found throughout the supply chain that retailers, suppliers, distributors and raw material suppliers have prioritized keeping costs low over resilience. The FTC Commissioner noted on March 21, 2024, that “just in time” inventory management and sourcing key products from only a few suppliers has made the supply chain brittle. The accompanying report, Feeding America in a Time of Crisis, provides the best publicly available picture of the industry that provides food-at-home.
The other component of FAH is convenience store purchases and other retailers, including some restaurants and food services that provide food intended for consumption at home. During the COVID-19 pandemic, many restaurants out of economic necessity moved into the FAH space. Even some traditional sit-down restaurants have found it to be a lucrative business and continue to provide take out food intended for consumption at home.
FAFH is has traditionally been provided by traditional sit-down restaurants and fast-food restaurants that generally do not provide the full service provided by traditional restaurants. Grocery stores have increasing moved into this space with cafes and other amenities that provide FAFH.
THE CONSUMER FOOD DATA SYSTEM (CFDS)
One can be expected to wonder how USDA can accurately collect all of the data necessary to identify trends in FAH and FAFH and the breakdown between the two categories. That is a remarkable story. The CFDS allows the USDA to do all of this and more. Figure 16.2 illustrates the sources of data that allow USDA to achieve this.
The center piece of this massive data collection and analysis effort is the National Household Food Acquisition and Purchase Survey (FoodAPS). USDA is continuously improving it. Rapid changes in the food industry necessitate this. Among the benefits of this information is a better understanding of what happened to the US food system during the pandemic. This information can help us plan for the next pandemic and other crises such as a major war or other disruption to our food system.
At the request of ERS, the Committee on National Statistics (CNSTAT) of the National Academies of Sciences Engineering, and Medicine appointed a committee of experts to advise ERS on improving the CFDS. Their report, A Consumer Food Data System for 2030 and Beyond, was issued in 2020.
The goals that the committee sought to further are that the CFDS be:
- comprehensive,
- representative,
- timely,
- open,
- flexible,
- accurate,
- suitable for causal analysis,
and maximize the return from federal research dollars.
The recommendations are technical in nature. A discussion of the recommendations in the report is beyond the scope of this text.
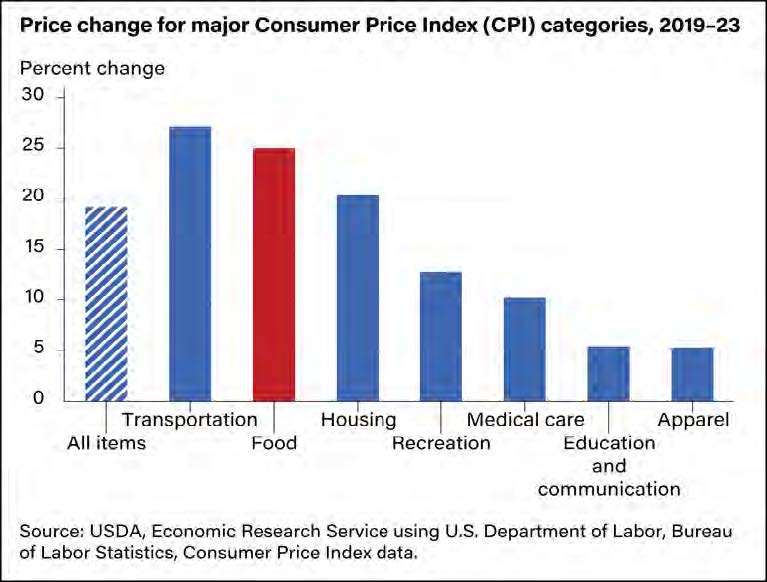
Figure 16.1 : Food price inflation
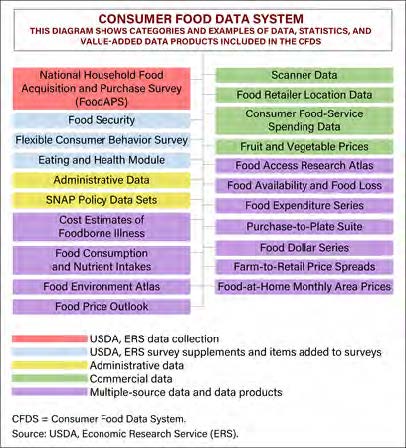
Figure 16.2 : Components of the CFDS

THE CONTROVERSY OVER FARM GATE SHARE
An enduring controversy evolves around the share of the consumers’ food dollar received by producers (farmers). Farmers receive about 14.9 cents of the consumers food dollar (Figure 16.3) for raw agricultural commodities. Figure 16.4 is a different way to look at how the food dollar is divided. Figure 16.4 shows the cost that each sector adds to the retail cost of food. As Americans shift to food away from home and more convenience, the nonfarm share of the cost of food will continue to grow. Another way that ERS breaks down the cost of food is by factors of production. The factors that ERS considers are by U.S. worker salaries and benefits, returns (rents) to food-industry property owners, output taxes, and imports. From Figure 16.5 note that the cost of labor at almost half is by far the largest of these factors. Returns to property come in second at 36.8 cents. For farmer-owners that do not pay themselves a salary, the money that they receive is divided between labor and rents to property. ERS imputes a salary to farmer-owners with the remainder assigned to imputed land rent.
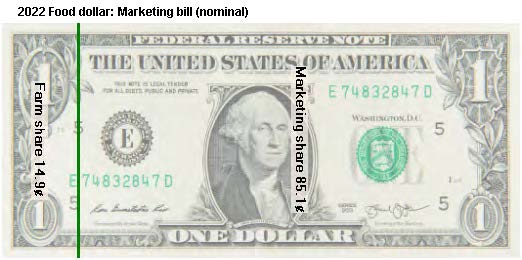
Figure 16.3 : Farm share
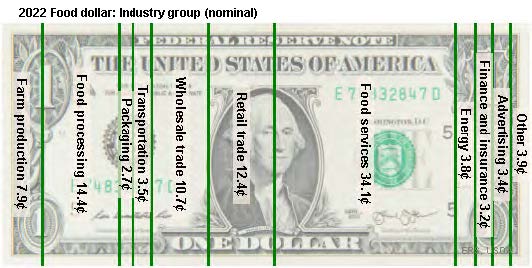
Figure 16.4 : Contribution to food cost V
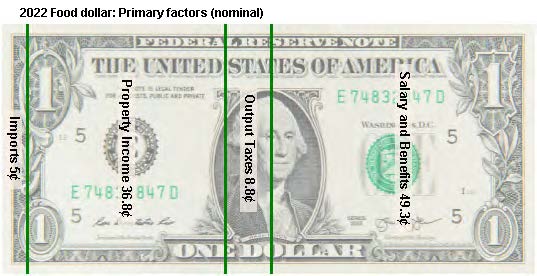
Figure 16.5 : Returns to primary factors USDA, Economic Research Service (ERS)
CURRENT ISSUES AFFECTING THE US FOOD SYSTEM
Issues both expected and unforeseen that affect the food system continue to arise. Some of those including the pandemic have already been discussed. Additional important issues include the relationship between food and health, food insecurity, and food deserts.
Why do we need to change our food system?
Relationship between food and health
The relationship between food and health has been recognized for millennia. As the US population has been increasingly wealthy and people live longer our most costly diseases have become chronic diseases sometimes described as “diseases of affluence”. Many of these diseases are associated with obesity. Diabetes is an example that is often cited.
The food industry has come under pressure since obesity is associated with highly processed, sugary products that have high margins and are extensively advertised. Federal farm programs have also come under criticism because many of the supported commodities are high in starch or fat. Markets for supported commodities were discussed in Chapter 7. As discussed in that chapter, sugar from both cane and sugar beets is a supported commodity.
Food insecurity
Despite the wealth of the United States many of its citizens do not have secure access to healthy, nutritious food. Most of these populations are those that were already marginalized in some way. Food insecurity is often the result of poverty and sometimes geography. Participation in the Supplemental Nutrition Assistance Program (SNAP) can be used as a rough measure of the number of people that are food insecure in the United States. The SNAP was formerly known as the food stamp program. SNAP is not intended to provide all of the food needed by an individual. As of September 13, 2024, there were 41,543,256 individuals in 22,111,144 households that were receiving SNAP benefits. The average individual benefit was $186.03, and the average household benefit was $349.52. The total SNAP benefit cost was $69,554,053,366.00.
Federal spending for food through SNAP and related programs such as the Special Supplemental Nutrition Program for Women, Infants, and Children (WIC) is a significant part of the market for food. There is considerable jockeying among food industry groups to be included in foods eligible for purchase through these programs. These programs are important indirect subsidies for many farmers. A notable victory for farmers’ markets (discussed in the next chapter) was to be made eligible for these programs.
The problem food insecurity has been particularly acute on Indian reservations with high rates of poverty and geographic isolation. It was accentuated by problems with a federal contractor during the summer of 2024. The federal government decided to improve efficiency by reducing the number of contractors distributing food to Indian reservations to one. Although the reasons for the failure are disputed, that contractor was apparently not up to the task of running a nation-wide food distribution program. As of this writing the matter has not been resolved. Some individuals continue to be without adequate food to prevent hunger.
Food deserts
Food deserts and food insecurity are often closely associated. A food desert is an area where grocery stores are nonexistent. Food deserts are often found in urban areas with high poverty rates and in some remote rural areas. In both cases these are areas where it is often difficult to profitably operate. For those too poor to have a working automobile, grocery stores are often unavailable. The only food stores available are often convenience stores. Convenience stores typically carry neither fresh vegetables nor fruits.
Genetic engineering
The technology for genetically engineering the genomes of crops, livestock, poultry, and fish has advanced in recent years. Gene editing tools such as CRISPR have significantly improved the ability to tailor crops, livestock, poultry, and fish to human needs. These tools provide the prospect of important improvements including more efficient production, drought tolerance, and disease resistance. It may even be possible to restore economically important species such as the American chestnut that were lost to disease.
Nonetheless there are important concerns. One such concern is the loss of containment. That means that the genetically modified organism escapes to areas where it is not wanted. Examples 16.1 and 16.2 provide illustrations of one possible harm. Another risk is that terrorists use the technology to create novel pathogens that attack crops, livestock, poultry, or fish.
Example 16.1. Alice grew a genetically engineered soybeans adjacent to Lonny’s organic soybeans field. Lonny saves seed from year to year. Bees cross pollinated his soybeans with pollen from Alice’s field. As a result, his subsequent soybean crop showed evidence of genetic engineering. He lost his organic certification since genetically modified or engineered crops cannot be sold as certified organic. He could not meet his contractual obligations to his buyer and could not receive the much higher certified organic price for his soybeans. He sued Alice for his lost revenue, alleging that Alice was negligent in planting her genetically engineered soybeans adjacent to his organic soybeans. The court ruled that conventional farmers owe a duty of care to organic farmers. The case was allowed to go to a jury to determine first whether the duty of care was violated. If the jury found the duty of care violated, it could then determine and award damages. [Lonny was fortunate to be in a state where the law holds conventional famers to a duty of care to organic farmers. Not all states protect organic farmers.]
Example 16.2. Leroy, an ichthyologist, was asked to determine why wild Atlantic salmon were dying in a particular river. He determined that wild Atlantic salmon had cross bred with escaped genetically engineered farmed salmon. The farmed salmon were bred for production. In the process of doing that some of the ability of the fish to survive in the wild was lost. The dying wild fish were offspring crosses with farmed fish. This resulted in fewer wild offspring that could restore the salmon runs in the river. Ultimately it further endangered an already endangered fish population.
References
Brasch, B. (2024, September 5). ‘Indian Country is hurting:’ How feds failed Native American food program. The Washington Post. https://www.washingtonpost.com/nation/ 2024/09/05/native-american-foodfdpir- shortage/
Coit, M. and Feitshans, T.A. (2020). Food Systems Law: An Introduction for Non-Lawyers. Routledge.
FoodIndustry.com. (2023, November). Who are the top 10 Grocers in the United States?. https:// www.foodindustry.com/articles/top-10-grocers- in-the-united-states-2019/#gsc.tab=0
FTC Staff. (2024, March). Feeding America in a Time of Crisis: FTC Staff Report on The United States Grocery Supply Chain and the COVID-19 Pandemic. FTC. https://www.ftc.gov/reports/ feeding-america-time-crisis-ftc-staffreport- united-states-grocery-supply-chaincovid- 19-pandemic
Graham, V. (2024, February 26). FTC Challenges Kroger’s Acquisition of Albertsons. FTC. https://www.ftc.gov/news-events/news/ press-releases/2024/02/ftc-challengeskrogers- acquisition-albertsons
Lordan, B., Gillman, A. and Ducore, D. (2015, January 27). FTC Requires Albertsons and Safeway to Sell 168 Stores as a Condition of Merger. FTC. https://www.ftc.gov/news-events/news/ press-releases/2015/01/ftc-requires-albertsons- safeway-sell-168-stores-conditionmerger
Marchese, K. and McLaughlin, P.W. (2024, January 29). Food Spending Shifted in Response to Pandemic; Changes for Food Away from Home Continued Through 2022. USDA Economic Research Service. https://www. ers.usda.gov/amber-waves/2024/january/ food-spending-shifted-in-response-to-pandemic- changes-for-food-away-from-homecontinued- through-2022/
National Academies of Sciences, Engineering, and Medicine. (2020). A Consumer Food Data System for 2030 and Beyond. The National Academies Press. https://doi. org/10.17226/25657.
Ronald, P.C. and Kliegman M. (2022, September 12). CRISPR in Agriculture. In M.L. Hochstrasser et al. (Eds.) CRISPRpedia. Berkeley: Innovative Genomics Institute, University of California, Berkeley. https://innovativegenomics. org/crisprpedia/crispr-in-agriculture/
Prell, M. and Coleman-Jensen, A. (2024, June 13). Consumer Food Data System (CFDS). USDA Economic Research Service. https://www. ers.usda.gov/topics/food-choices-health/ consumer-food-data-system-cfds/
Slaughter, R.K. (2024, March 21). Statement of Commissioner Rebecca Kelly Slaughter Regarding the FTC Staff Report, Feeding America in a Time of Crisis. FTC. https://www.ftc.gov/ system/files/ftc_gov/pdf/FinalStatement- Slaughter-FeedingAmerica.pdf
Sweitzer, M. (2024, February 14). U.S. food prices rose by 25 percent from 2019 to 2023. USDA Economic Research Service. https://www. ers.usda.gov/data-products/chart-gallery/ gallery/chart-detail/?chartId=58350
USDA Food and Nutrition Service. (2024, September 13). SNAP Data Tables. https://www. fns.usda.gov/pd/supplemental-nutritionassistance- program-snap